
Language: Deutsch · English
 Charts
Display values as a chart in the form – via a chart business object and the chart component in the layout.
HOW-TO APPLICATION DEVELOPER UPDATED: JUL 2026 APPLIES TO NUCLOS 4.2026.X
On this page
What is a chart business object?
A chart displays values graphically (e.g. a customer's revenue). The values come from a chart business object – technically a data source that, like a dynamic BO, is attached to the parent record as a sub-form.
Menu: Configuration → Data sources → Chart
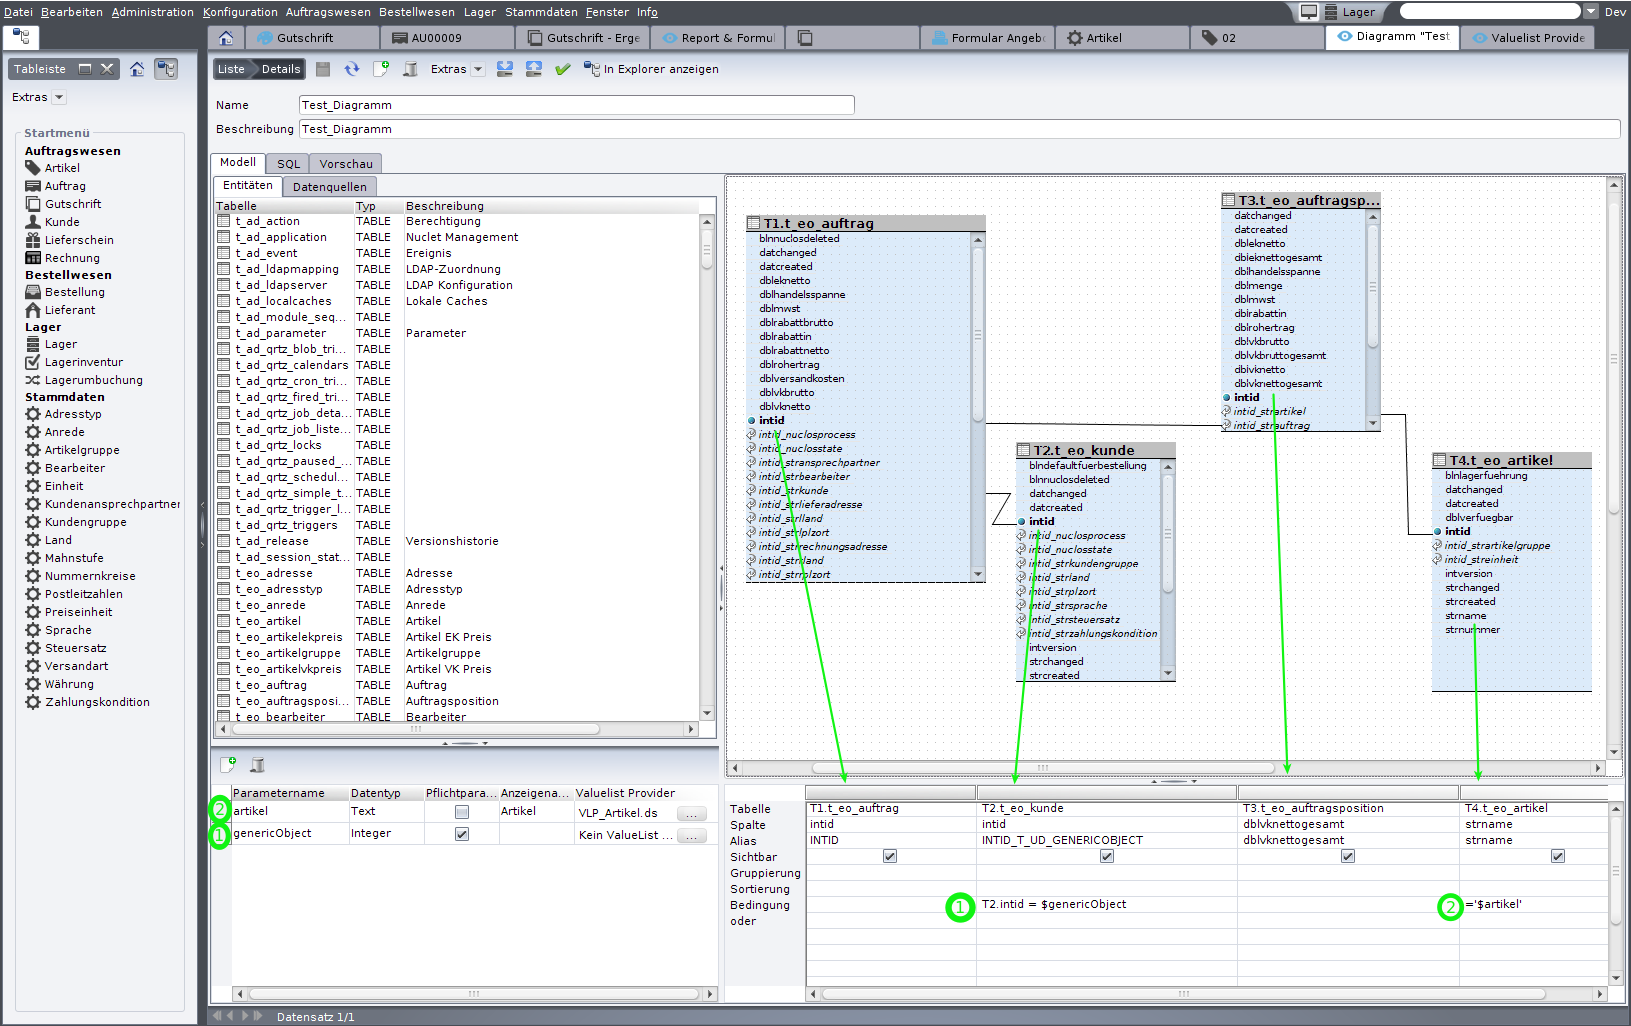
Example: revenue as a chart.
Step 1: create the chart business object
The data source needs the mandatory columns INTID and INTID_T_UD_GENERICOBJECT plus the parameter genericObject (present by default) pointing to the target object. Further parameters (also with a value list provider) can be shown next to the chart. All additional columns are available for display (alias = column header).
Step 2: authorise it as a sub-form
The chart BO behaves like a sub-form of the parent BO. Permissions are granted under Configuration → status model → Permissions tab – for every status.
Step 3: embed the chart in the layout
In the layout editor add a new tab and place the Chart component via drag&drop. In its properties set the underlying BO and the parameter under foreign key. Via advanced properties you choose the chart type, domain data (the chart BO's attributes) and the look&feel.
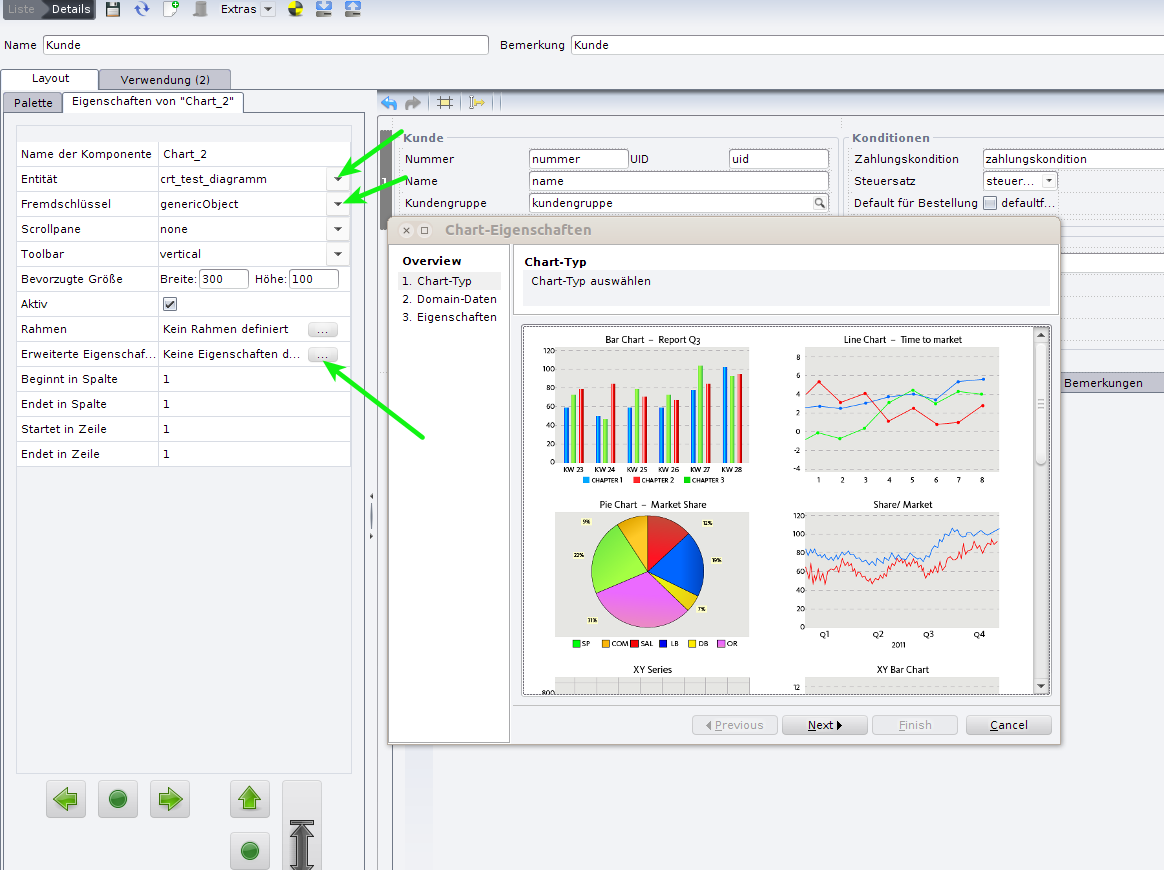
Chart component and advanced properties.
Related pages
Überblick
Inhalte