Nuclos dashboard charts: configure charts from task lists/search filters, choose category and values, enable for user groups. |
Language: Deutsch · English
Configure charts on the Web Client dashboard from task lists and search filters.
On this page |
Available from Nuclos 4.2023.27. Non-super users need the system right Configure dashboard. |
Switch to the dashboard (Nuclos gear, top right). Create a new dashboard via the „+“ tab at the top left; the configuration opens immediately.
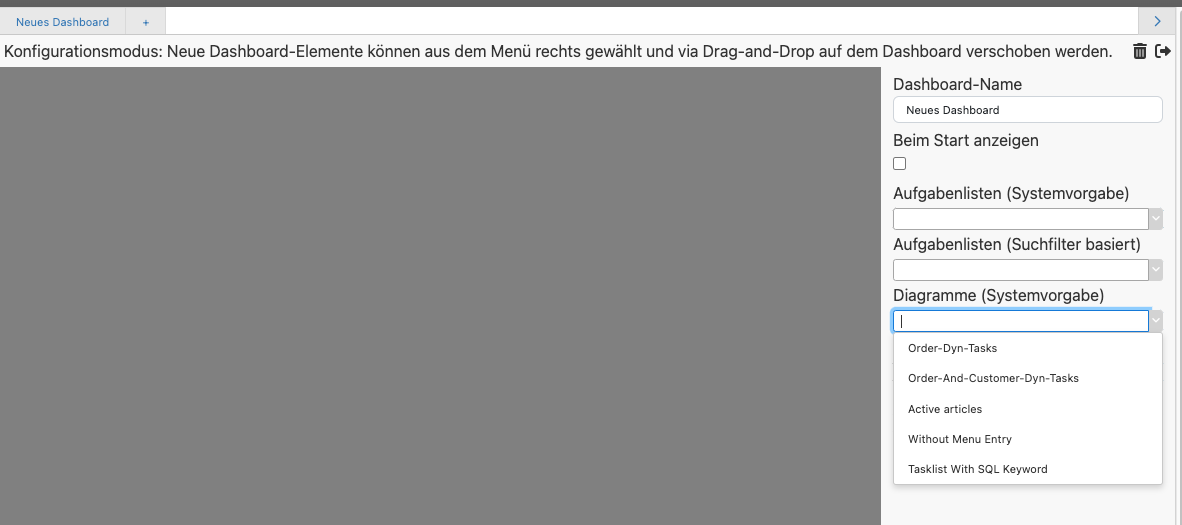
Dashboard configuration.
On the right there are two chart dropdowns (filled with task lists/data sources and search filters). Pick an entry → a tile is created. Use the config gear to set the values (y) and category column (x).
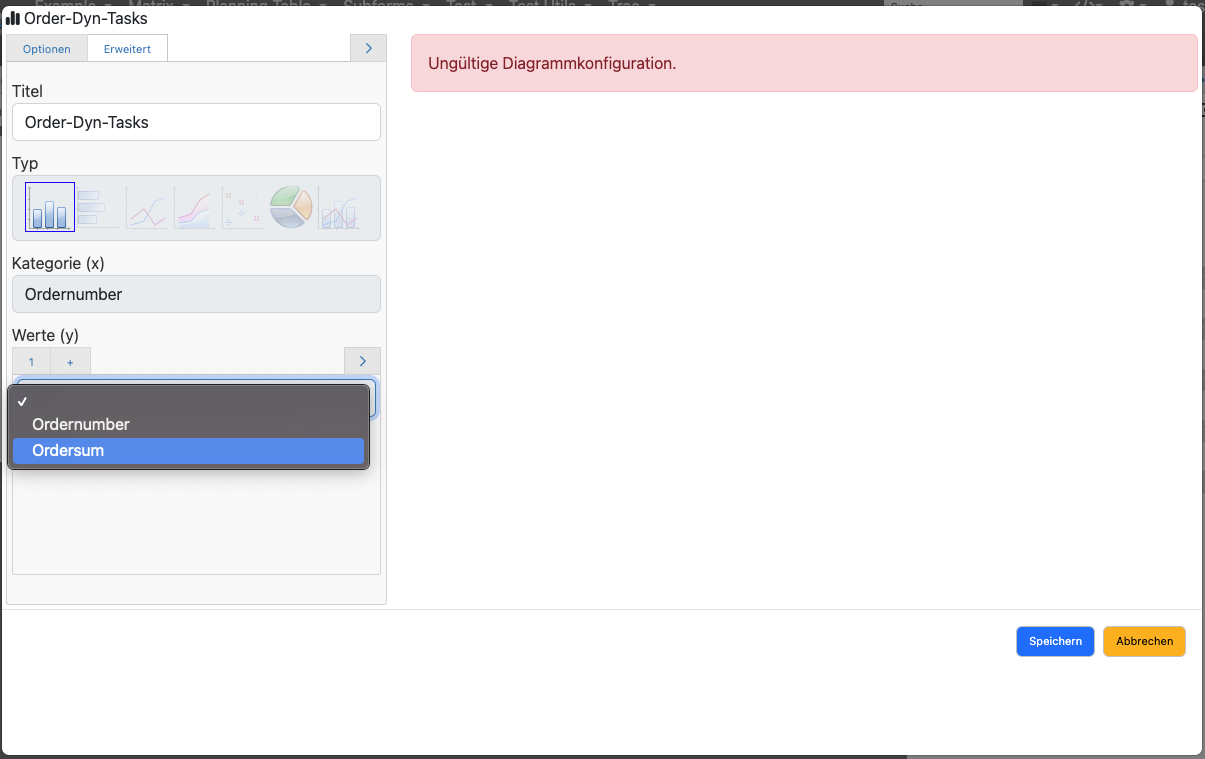
Chart configuration with category and values.
Important: the task list must have at least one numeric field. Recommendation: keep under 10,000 rows. Choose a sensible category column, otherwise nothing or 0 is shown. |
By default the bar chart appears; chart type and name are adjustable.