Nuclos Jasper multi axis chart: chart axis, position rightOrBottom, chart customizer, CategoryPlot, XYPlot, AxisLocation. |
Language: Deutsch · English
Combine several charts in a multi axis chart and position axes via design, XML or a customizer.
Auf dieser Seite |
A multi axis chart combines several charts of the same type – e.g. with separate axes on the left and right.
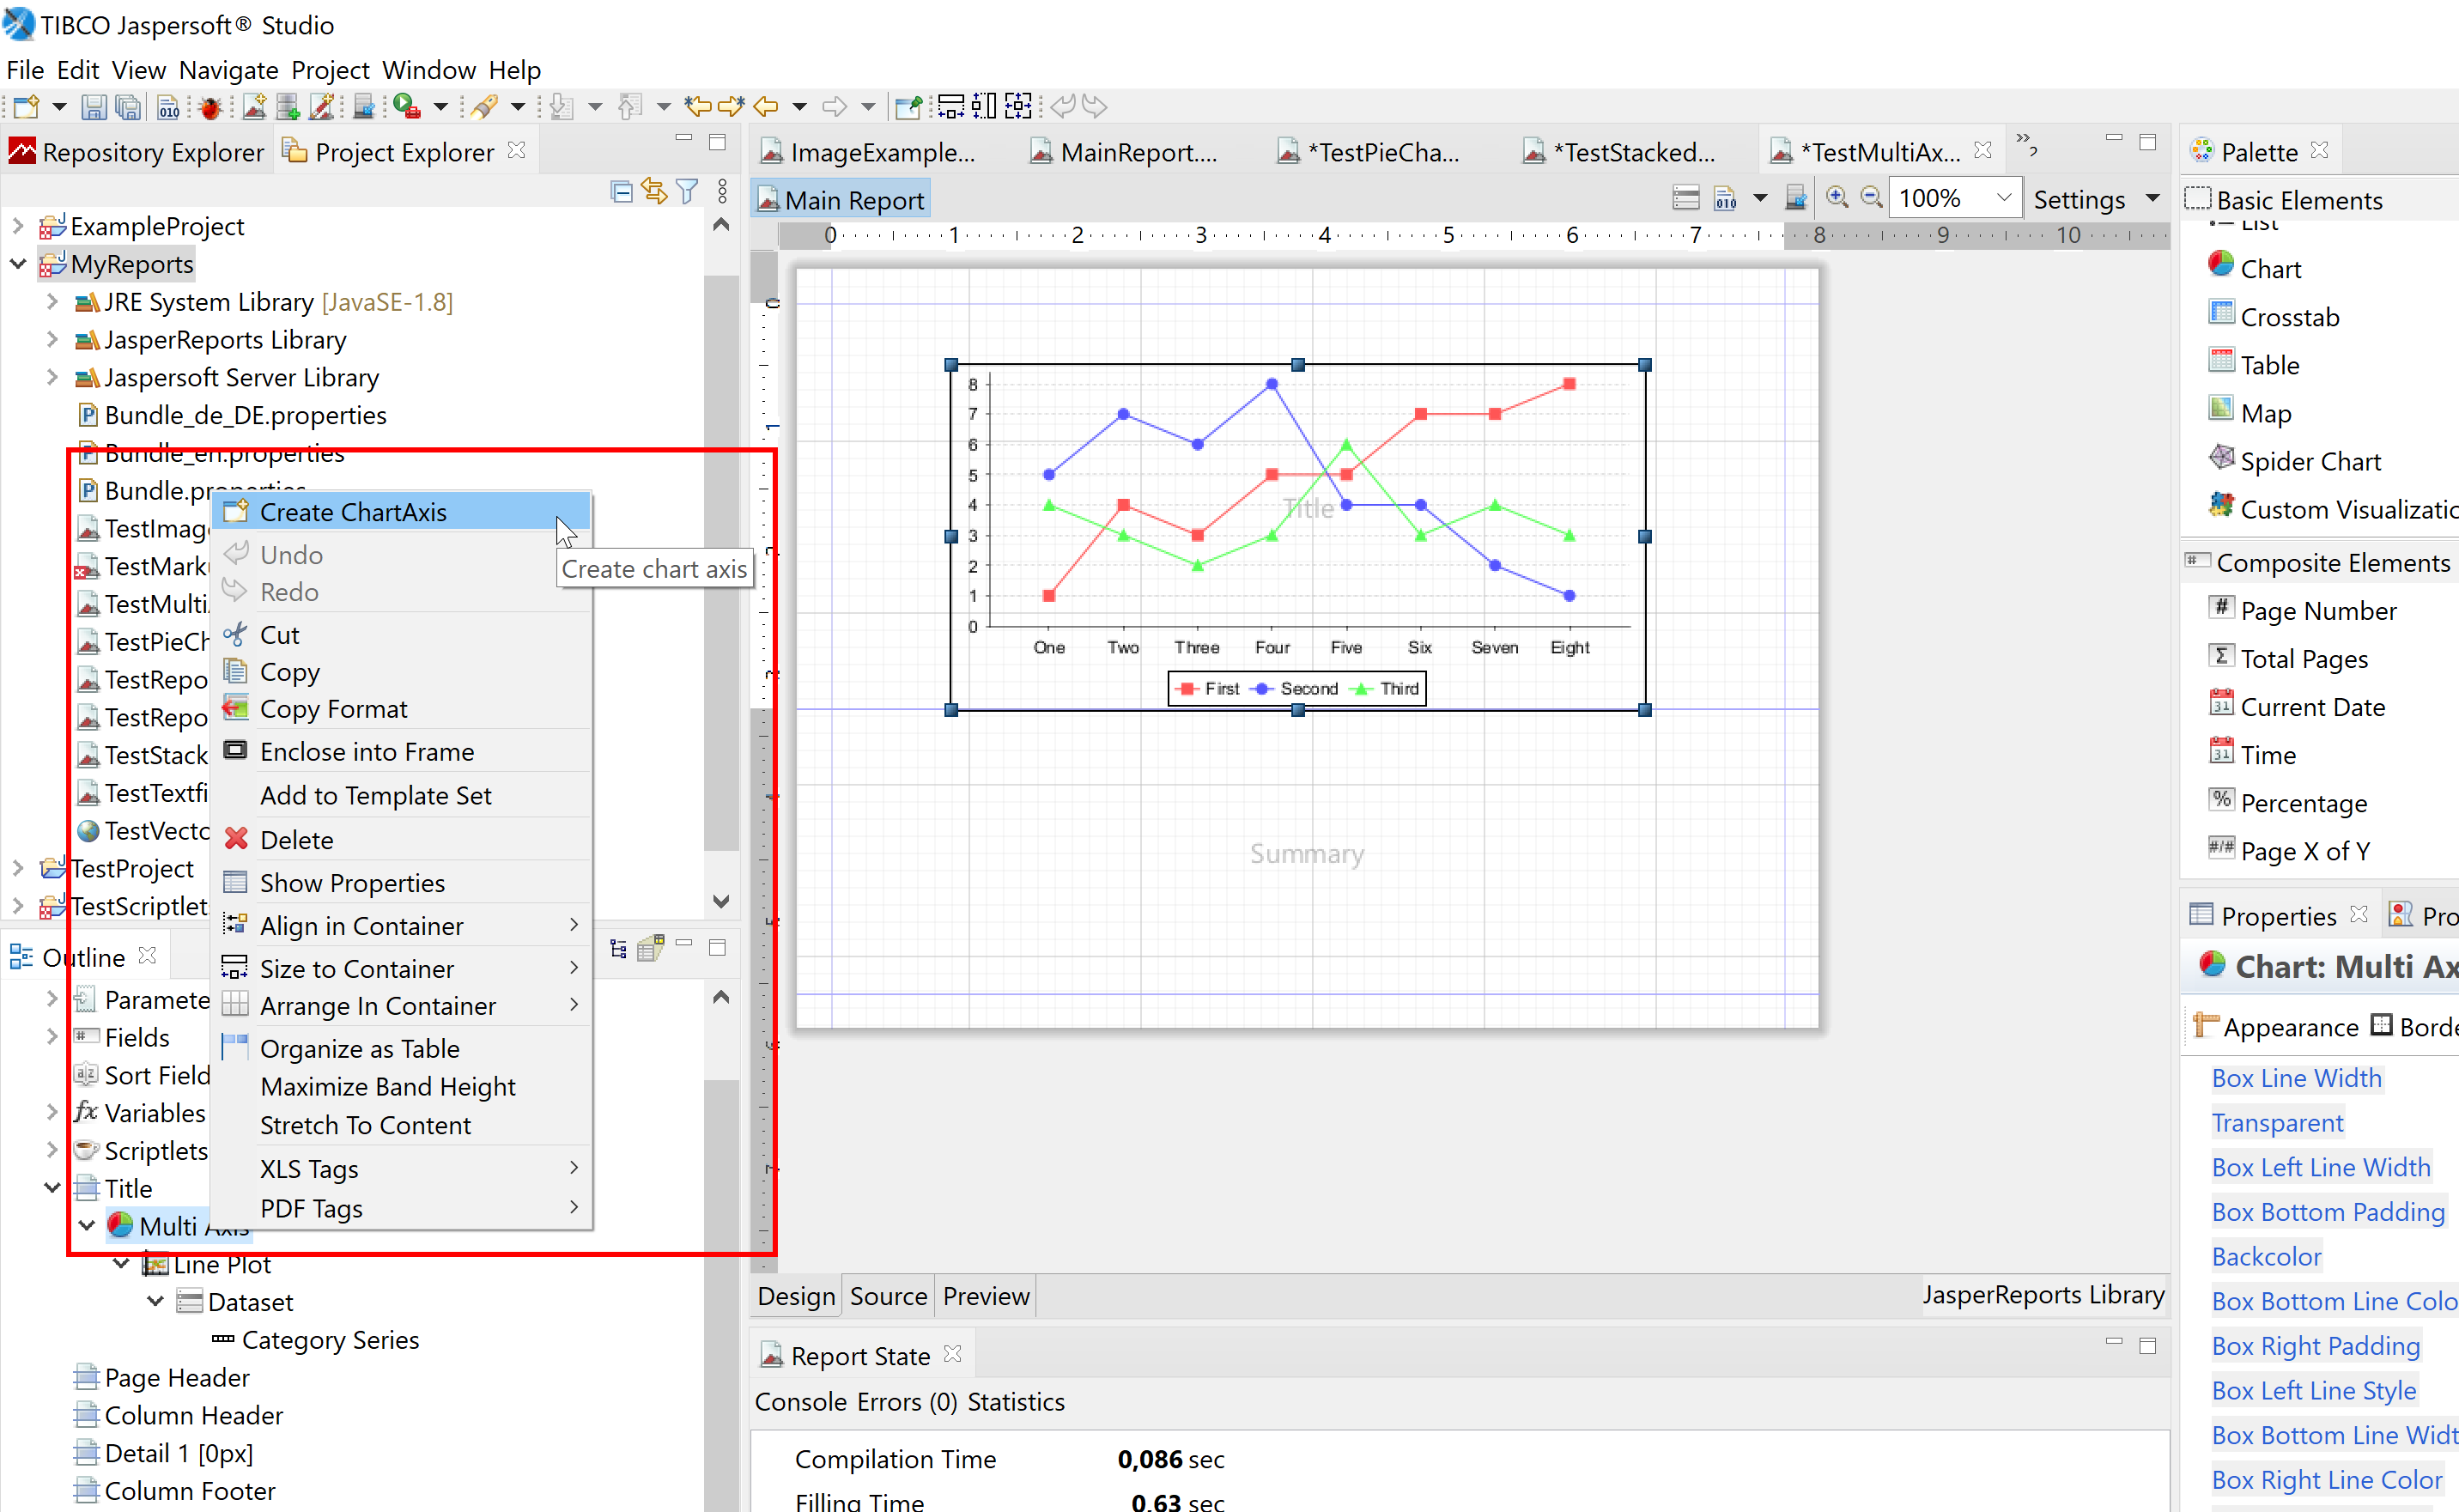
Multi axis chart in the wizard.
Select the chart axis → tab Chart Axis → desired position.
Each chart inside <MultiAxisChart> starts with <axis>; add position="rightOrBottom" there.
@Override
public void customize(JFreeChart chart, JRChart jasperChart) {
        Plot plot = chart.getPlot();
        if (plot instanceof CategoryPlot) {

         ((CategoryPlot) plot).setRangeAxisLocation(AxisLocation.TOP_OR_RIGHT);
         ((CategoryPlot) plot).setDatasetRenderingOrder(DatasetRenderingOrder.FORWARD);

        } else if (plot instanceof XYPlot) {

            ((XYPlot) plot).setRangeAxisLocation(AxisLocation.TOP_OR_RIGHT);
            ((XYPlot) plot).setDatasetRenderingOrder(DatasetRenderingOrder.FORWARD);
		}
}
|