Jaspersoft stacked bar chart: Series, Value, Category, stacked bar 3D, JFreeChart, chart in report. |
Language: Deutsch · English
Stacked bar chart in Jaspersoft Studio – set Series, Value and Category correctly.
Auf dieser Seite |
A stacked bar chart visualises the proportional development of several categories over multiple points in time/steps. Variants: stacked bar and stacked bar 3D.
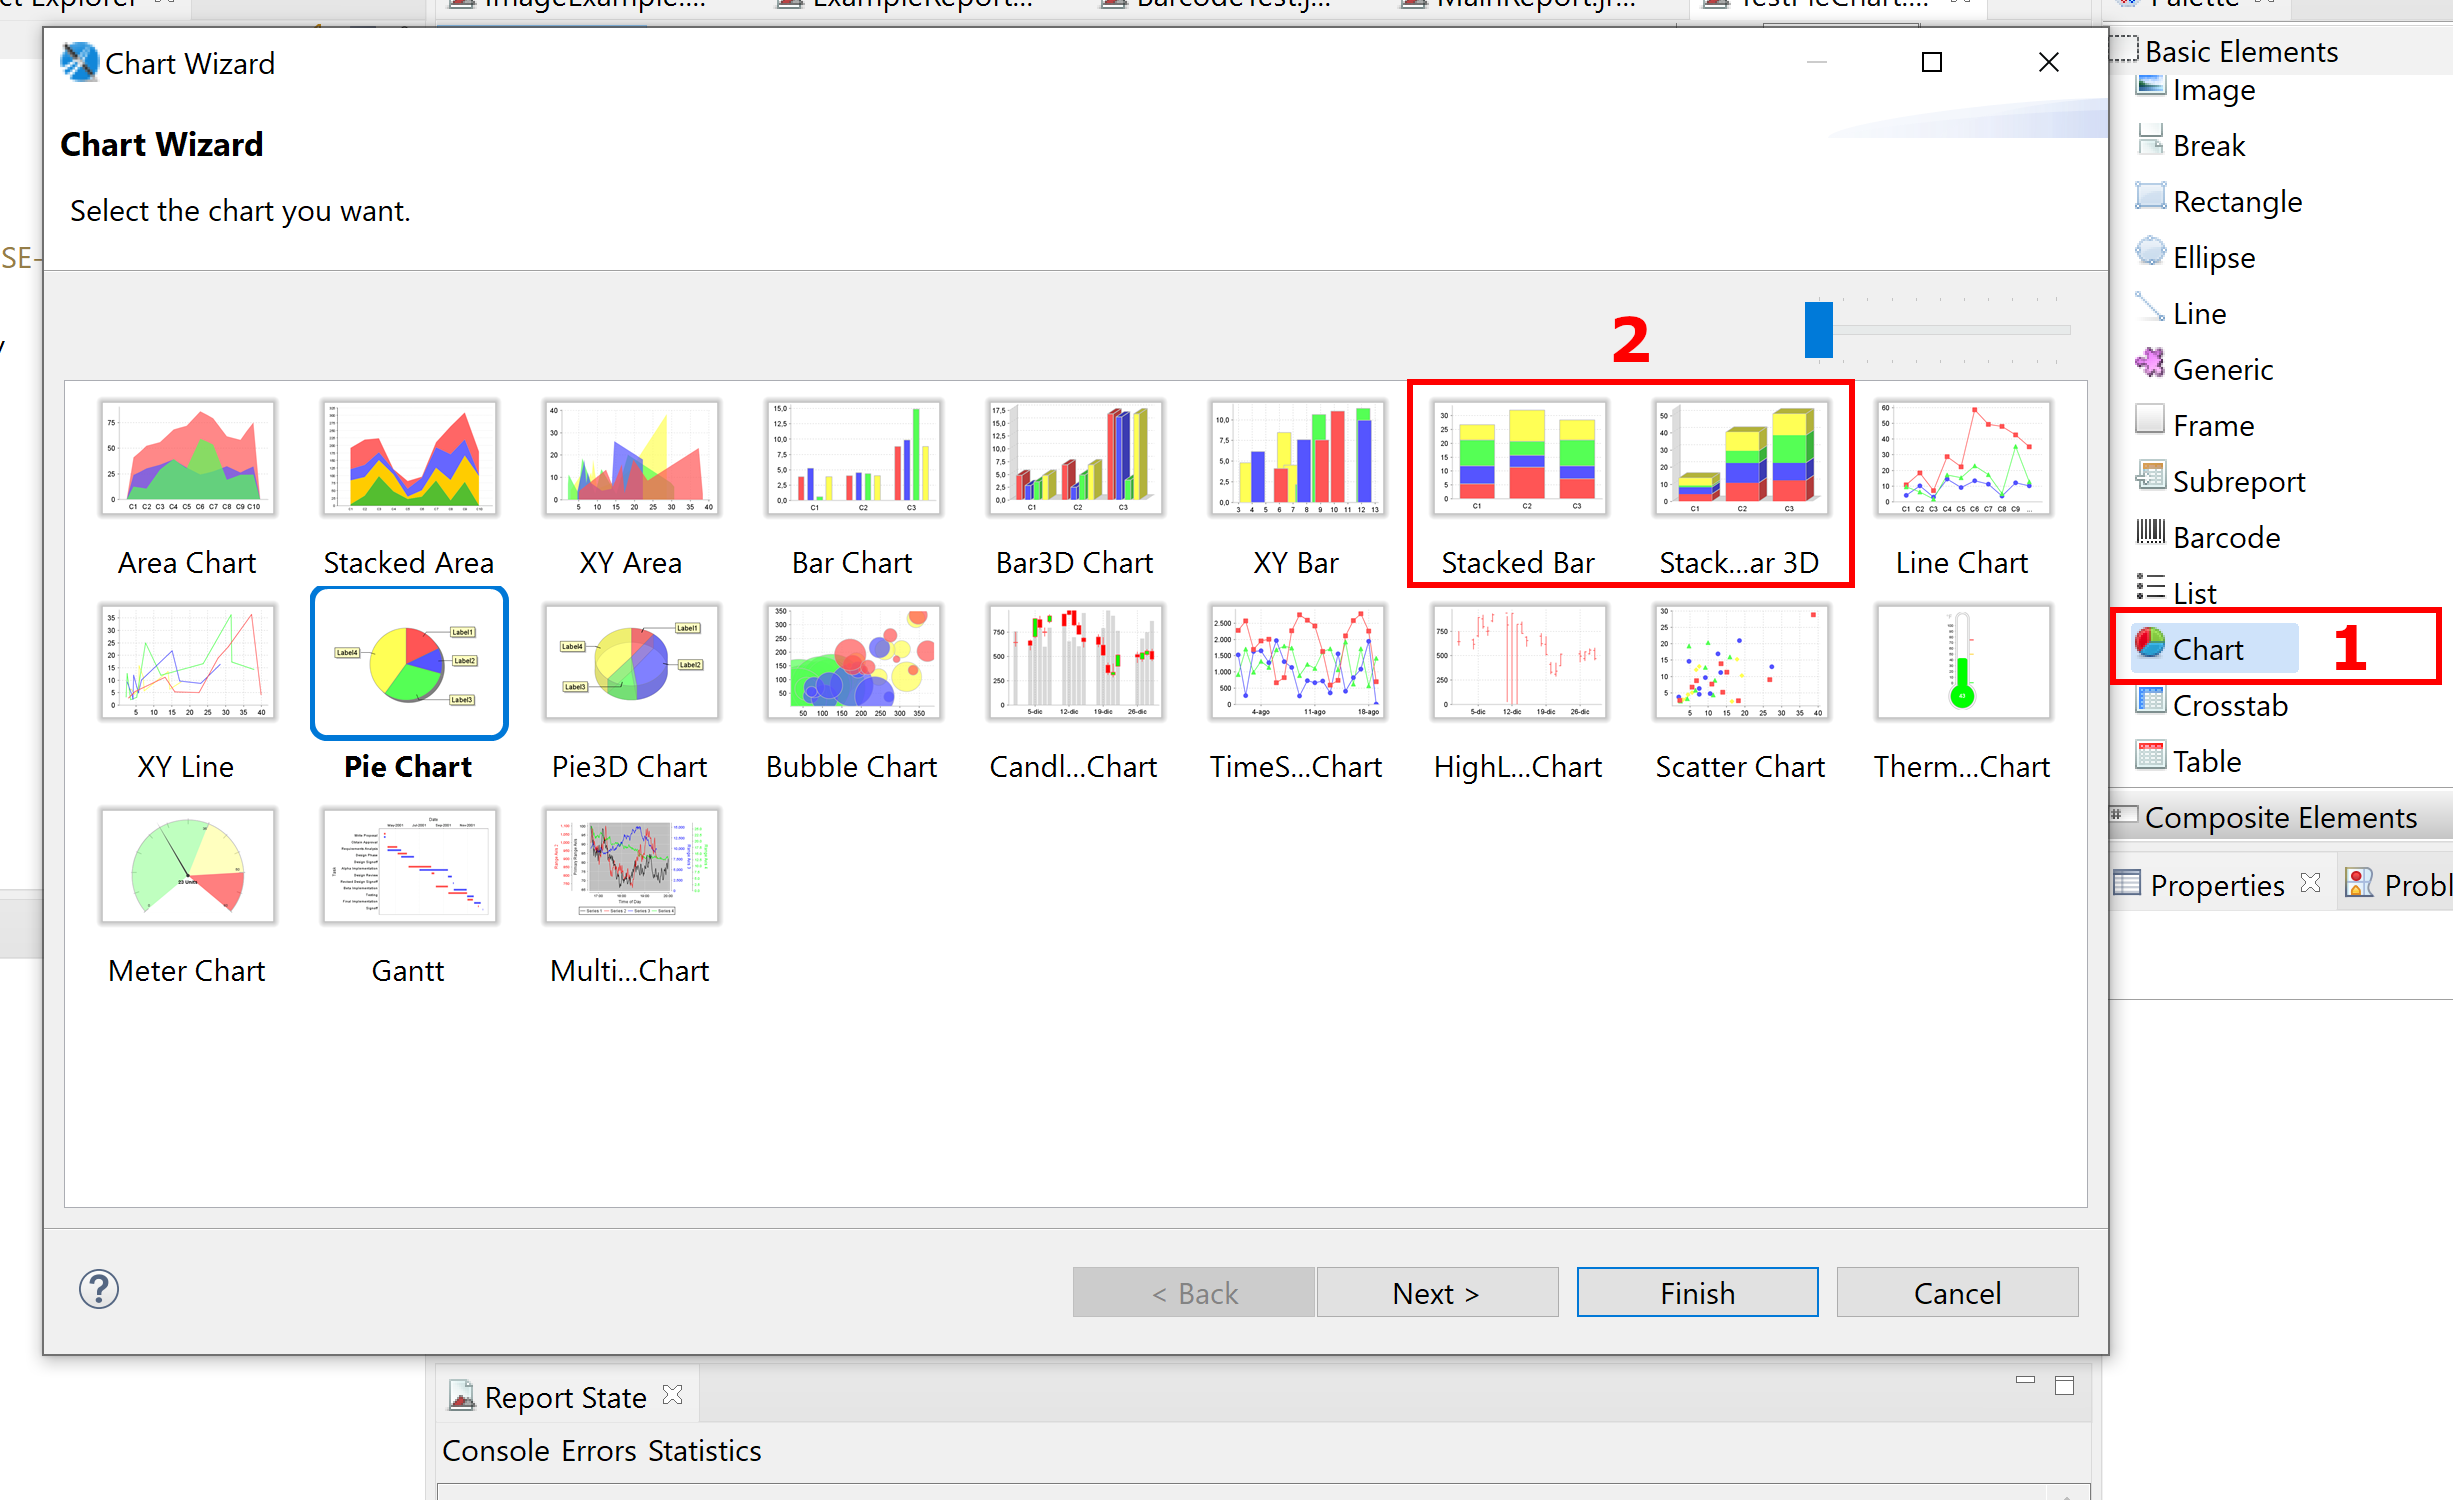
Chart selection dialog.
| Field | Meaning |
|---|---|
| Series | bar categories within a bar (also in the legend). |
| Value | value-determining field on the y-axis. |
| Category | unit on the x-axis (often a time unit). |
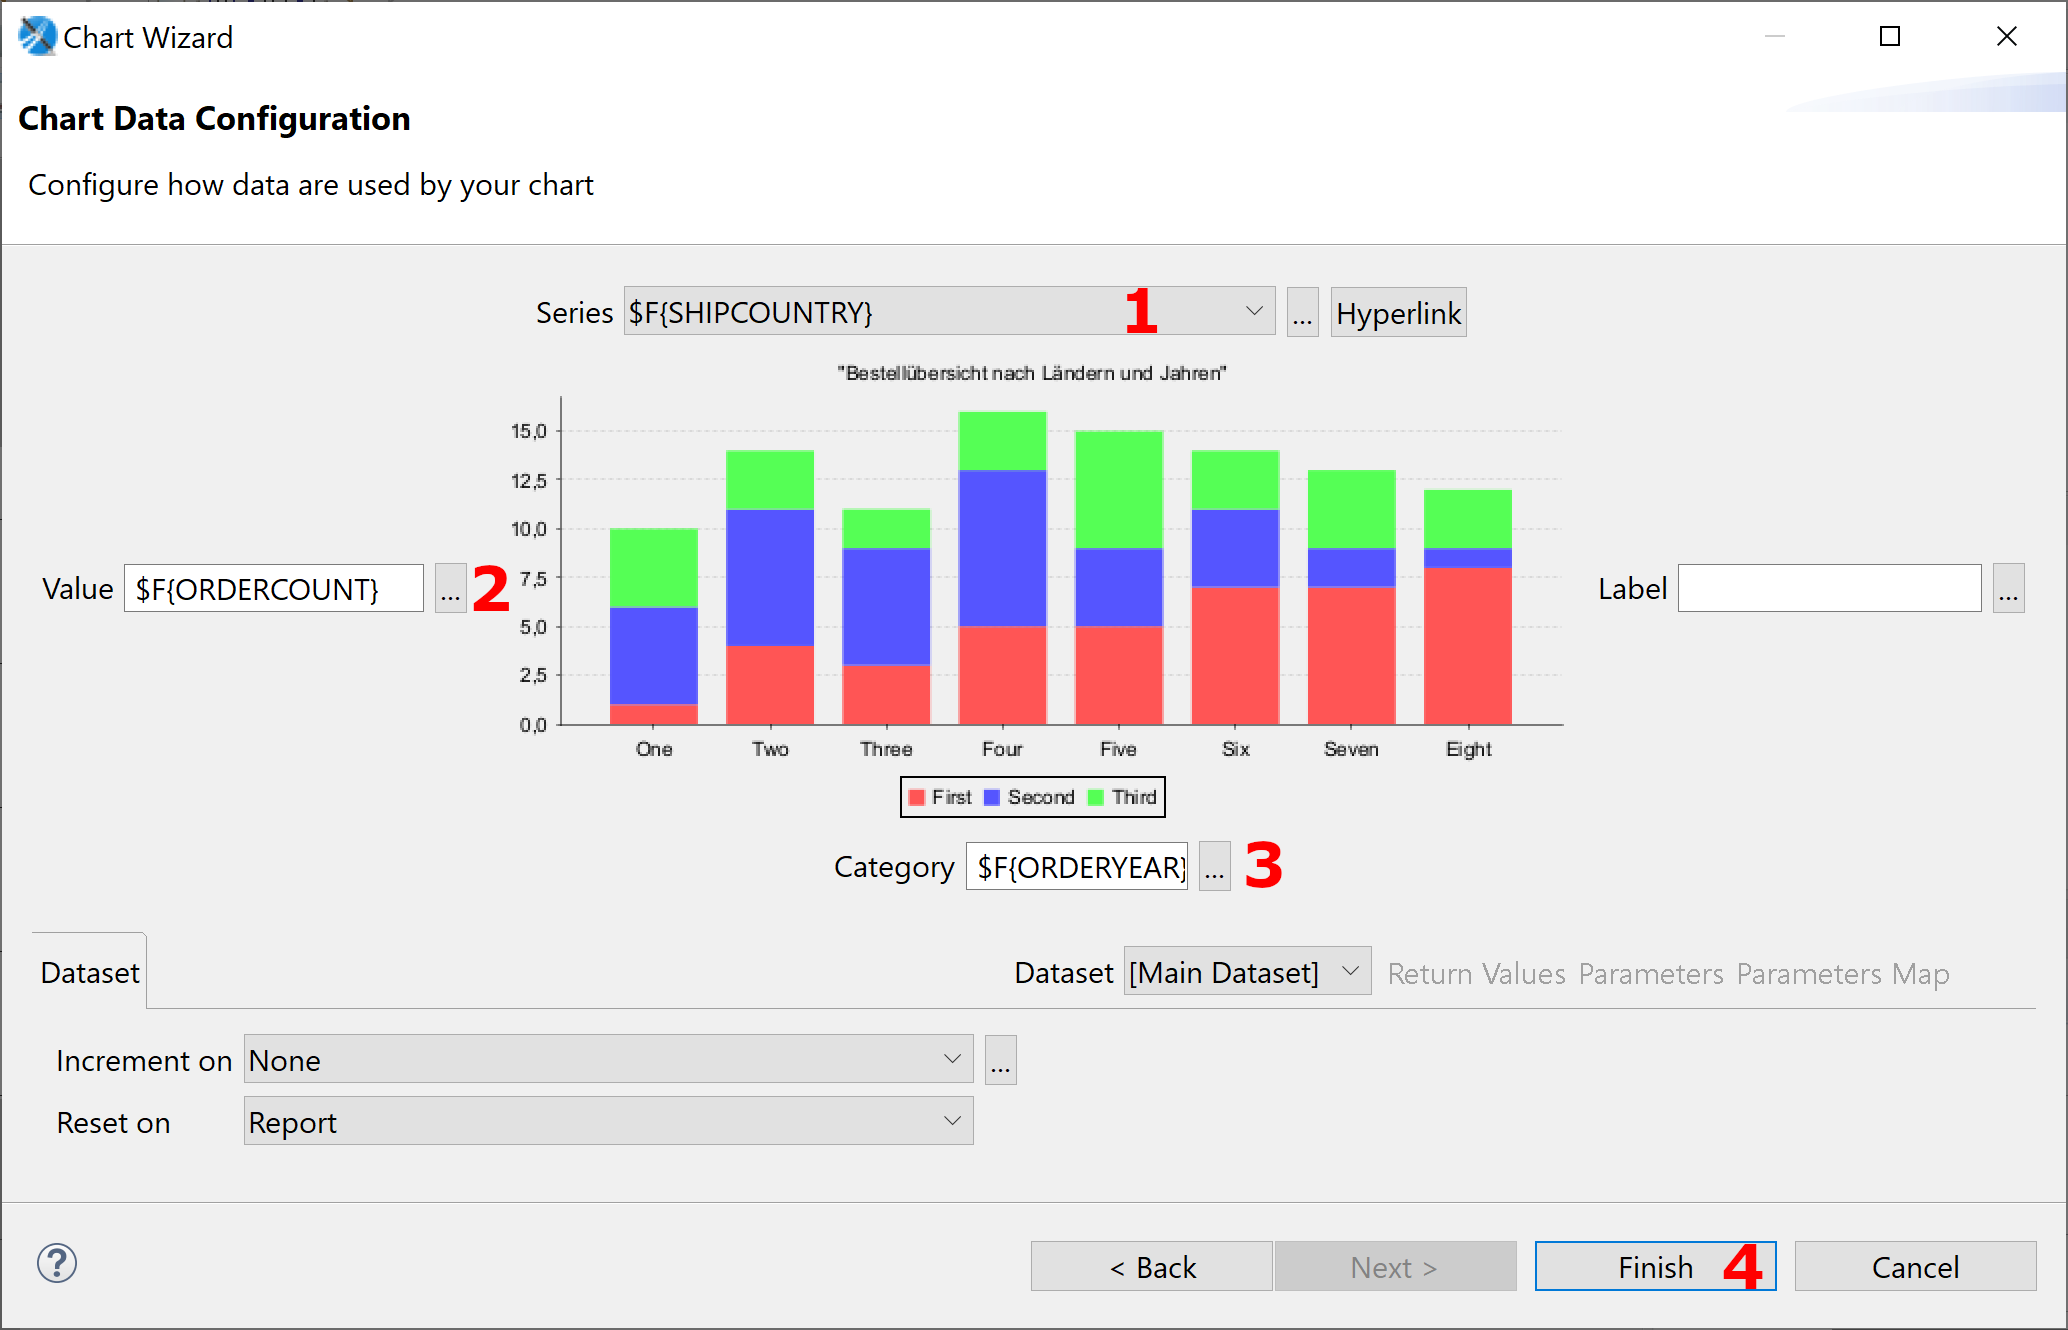
Stacked bar chart configuration.

Result.